Financial analysts love data that is presented in a well-structured, easy to understand format.
A quick glance will usually tell them if the information being presented is something they will be able to understand, and is something they can work with.
Data charts and tables can be powerful communications tools. When large amounts of data are involved, creating these charts and tables by conventional methods can be extremely time consuming, if not overwhelmingly so.
Even with the use of data-crunching tools, the ability to present the results in an easily understandable format is often a challenge.
As a businessman, you want data and information presentations to be interactive, up-to-date, and presented in a structured manner. What you need therefore, is a tool that can take large amounts of data, and from that data create well-structured, responsive, interactive charts and graphs.
That tool is a WordPress Plugin.
With this plugin, you’ll have no problem in providing your clients and customers with usable, reliable, information that is consistent with your brand, and provided in a timely manner.
The Number One Charts and Tables Plugin on the Market Today – wpDataTables
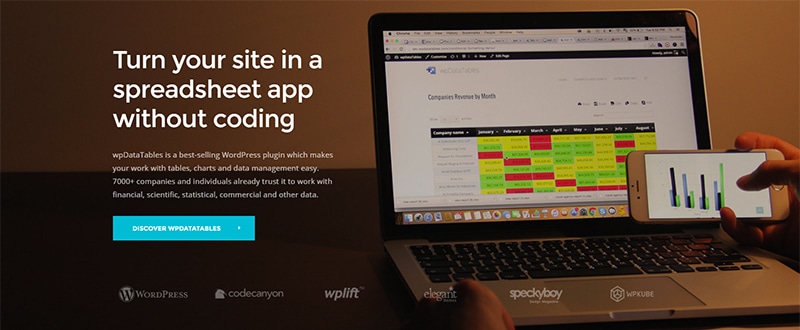
wpDataTables is a WordPress plugin that you can take out of the box and immediately put it to use. All you need to do is provide the data, and the format you want to present it in, and this remarkable plugin will do the rest.
The multiple features this WordPress tool brings to the table says it all.
- Big Data – the large data handling capabilities are especially impressive. Since wpDataTables relies on MySQL server, literally millions of rows of data can be accommodated.
- Ease in Editing – data can be edited from both the front end and the backend.
- Responsive – charts and graphs will be clearly and accurately displayed on any device.
- Highlighting – this special feature allows you to highlight a range of values in a selected color.
- Advanced Filtering and Searching – this feature allows users to interactively work with the charts and graphs you’ve given them.
- Wizard – wizards allow things to happen; these wizards make building graphs and charts an easy task.
- Retrieving Data – data can be pulled from Excel, MySQL, or any other conventional source – in real time.
Creating Editable Tables on Your Website
The Table Constructor feature allows you to import spreadsheet files, auto-generate SQL queries on tables, and create SQL tables from the dashboard. Complicated MySQL queries are not a problem, and the analytical results can be submitted to a remote MySQL server. The advanced filtering table gives you even more data analysis options.

Choosing a Format
Google Spreadsheets, Excel, MySQL queries, JSON, you name it; this plug in can accept and work with virtually any standard data format. The data, in any format, will then be arranged in responsive tables for complete and accurate presentations on any device.
Creating Charts Quickly
The wpDataTables plugin is the data presentation tool you need when time is of the essence. Information is “bent” into place to create beautiful visualization charts without compromising quality. You can even select color schemes in keeping with your brand from the dashboard.
Creating Tables with Large Amounts of Data
wpDataTables can manage impressively large quantities of data – because it is smart. It uses the MtSQL engine, with a little help from an Ajax request, to do so.
Users can File the Data Away
The tables this plugin creates are WordPress tables; so it is easy for the user to print them out, save them, or do both. The net result – the user is given the ability to disseminate the data, or save it, and retrieve it at some future time.
Over 7,000 Companies Around the World Use wpDataTables
A large percentage of the companies that make good use of this plugin do so for financial reporting, but wpDataTables is also used for a number of other data analysis and presentation applications. Huge sums of data are often generated in scientific studies and agricultural statistics and projections.

The plugin also serves as a valuable tool in such diverse areas as marketing, advertising, education, and sports betting.
Should you find yourself surrounded by reams of potentially valuable, but incomprehensible data, this plugin will solve your problem. 7,000+ companies can’t be wrong.
wpDataTables has the Features and Customer Support You Want in a Data Manager
wpDataTables is super easy to use. You might expect that a tool that can handle large amounts of seemingly incomprehensible data would require a great deal of tweaking to give you the results you’re looking for. That’s not the case at all.
The following features are the reason why that is the case:
- The ability to manage very large tables of data.
- Responsiveness
- An ability to edit tabular content inline or in a generated form
- Advanced filters that narrow down to data of interest
- An ability to highlight data based on its content or range of values
- The ability to create charts using tables as data sources
Data can be pulled from any source. If you’re not overly familiar with SQL, you can turn the work over to the Query Generator. Use the wizards to create tables and/or charts – easily and intuitively.
Nearly 9 out of 10 users of this plugin have put the advanced filter capabilities to good use. 75% of them use, or have used, the MySQL visualizing feature, and a third of all users have used the front-end editing feature for MySQL tables.
A wide majority of users, over 80%, report that they have found wpDataTables both intuitive and easy to use as well as being functionally perfect for performing the data presentation tasks at hand. Some have even customized this plugin to fill specific needs, and virtually all of the users consider the customer support organization as top class in all respects.
wpDataTables Recent Updates Worth Noting
These latest two updates were incorporated as a result of user feedback:
- Sum/Totals Row – By simply ticking a checkbox, the totals for any column can be calculated at any time. Should you filter the table, or change the values in any way, the sums are automatically recalculated.
- Conditional Formatting – This popular update allows you to highlight value ranges or different types of content in different colors. This can save you hours of searching when working with large amounts of data. Conditional formatting also adds to the appearance of a table for presentation purposes.
WpDataTables 1.7 will be launched soon and comes with a very helpful feature.The table data will be shown in an editable spreadsheet. Similar to the Excel editor and viewer.